All maps begin with data and in this exercise the data came, for the most part, from two sources. The source of the aerial data (quarter quadrants) is the Land Boundary Information System (labins.org) of the Florida Department of Environmental Projection (who themselves sourced the data from USGS). The source of the shapefile data is the Florida Geographic Data Library (Metadata Explorer). I practiced searching their databases, finding the information I needed, and downloading all necessary files. {This lab turned out to be an exercise in organization as well since there was a lot of data to manage.}
Once I had all the data I needed, I had to work on rectifying their coordinate systems. Thus, the main goal of this lab – to improve working knowledge of coordinate systems. The raster data (aerial data) possesses a native coordinate system different than that of the other layers. After loading all of the data into ArcMap, I reprojected any “mismatched” data into the coordinate system of the aerial data. This is a crucial step if a map reader is to discern anything useful from your map. This is especially the case in the event of analysis. A map would be meaningless if its data was in various coordinate systems.
Another new skill the lab introduces is calculating tabular data. I used a spreadsheet to calculate the x and y coordinates from latitude and longitude data (degrees, minutes, seconds to decimal degrees). This information, when imported, lacked a defined coordinate system. Once it was defined, the point data aligned with the rest of the layers on the map. Additionally, I reinforced some skills I learned in previous labs like converting text to annotations and adding extent indicators to an inset map. The final product of the lab is the map below.
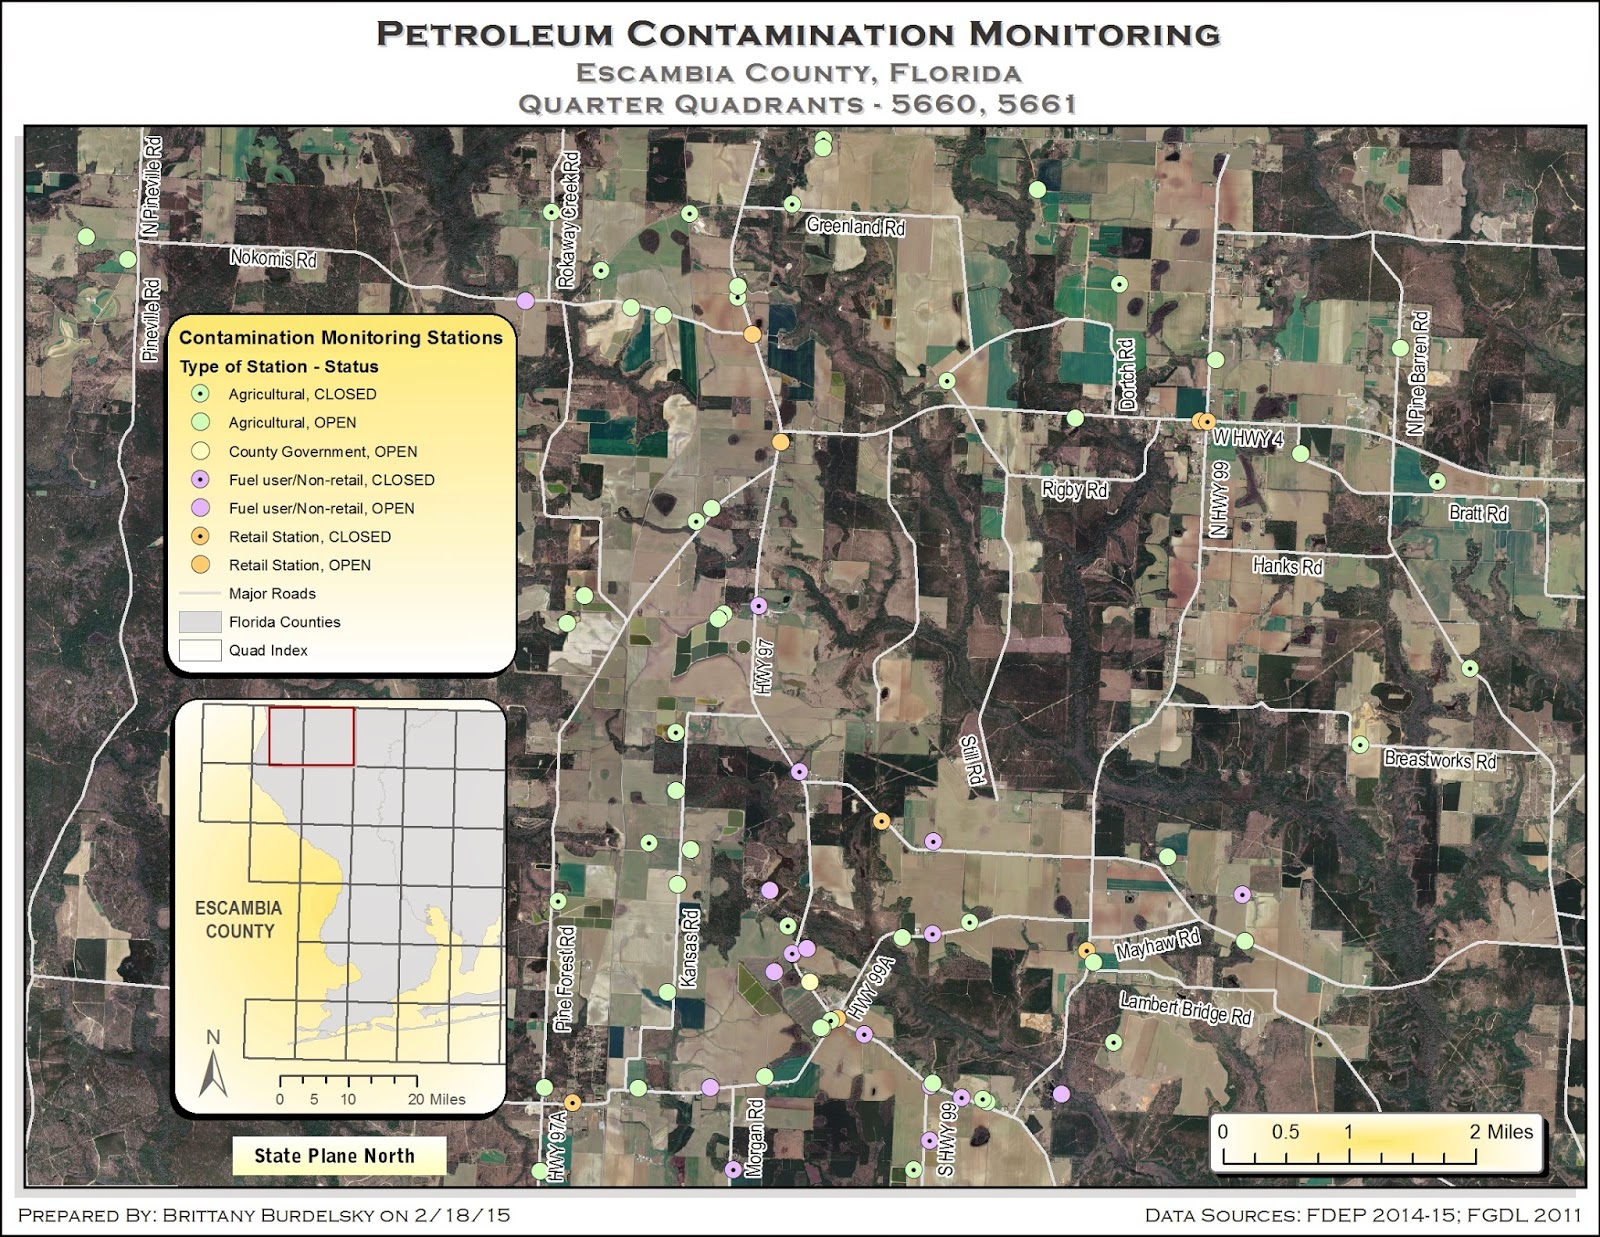 |
A map displaying two adjacent quadrants within Escambia County, Florida.
Locations of monitored petroleum tanks are shown and explained in the legend.
An inset map with quadrants over Escambia County shows the extent of the quadrants under examination. |
My map displays two quadrants (5660, 5661) from the northwestern portion of Escambia County, Florida along with the locations of petroleum tanks monitored for contamination. Major roads are included to provide greater context within the mapped area. The point data are represented by circles that are colored by type and symbolized (as an open or dotted circle) by status. I noticed a large empty space in the western portion of my mapped area. I filled that space with the legend and inset map. The aerial data is busy so I opted for pastel colors that can be easily picked out but do not add to the background clutter. (Perhaps it is time to learn about layer transparency). I added drop shadows to the legend, inset map, and scale to lift them off of the background. I added masks to the road name text. I thought this made them more legible against the aerial images.
No comments:
Post a Comment