Thursday, September 22, 2016

Special Topics: Module 3 - Finding Maya Pyramids (Part 3)

     This module wraps up our discussion of and practice with locating archaeological data with satellite imagery. Specifically, this week focused on disseminating our results with a wider audience through the publication of layers and maps for use in Google Earth (as it is user friendly and has a wide usership - hah wasn't sure that was a word...).
     Two tools in the Conversion toolbox create file formats (.kml/.kmz) that can be opened in Google Earth. These tools are the Layer to KML and Map to KML. Below is a screenshot of one of the map open in Google Earth. It is quite handy. You can move between the layers of your map to toggle them to display or not. We've used these tools in the program before when we displayed our dot density maps of South Florida for the Cartography course. I also use the Layer to KML tool in work to share non-sensitive data (usually fire related) information within the Forest Service. Putting what you learn to use is always exciting. I am very much looking forward to the next module on predictive models because I am going to using those skills at work too. Fun, fun.

Screen capture of my map product displaying in Google Earth.
The false color (4, 3, 2) composite is showing. Vegetation is in red.


Wednesday, September 14, 2016

Special Topics: Module 2 - Finding Maya Pyramids (Part 2)

     Last week we used Landsat 7 ETM+ data to examine the vegetated area obscuring the La Danta pyramid and archaeological complex (a Maya site located in Guatemala). Since the location of the complex is known it was used as a control to see if any other areas could be hiding, based on spectral similarities, archaeological structures. First, a new spectral band combinations (new as last week we looked at a false color and natural color composite) and a normalized difference vegetation index (NDVI) image were generated. Once these images were generated, I performed a supervised classification to search for probable site locations to survey.
     I used the NDVI tool in the Image Analysis window to generate the NDVI image. This index is use to determine relative biomass and health of vegetation. Differences in plant growth patterns or in plant health can be used as indicators of the presence of material remains. The NDVI image can help in detecting these differences.
     I used the Composite Band tool again to generate two different band combinations - 7, 5, 4, and 4, 5, 1. The first band combination is ideal for penetrating atmosphere/smoke and highlighting the difference between bare soil and vegetation. The latter band combination is idea in detecting the various stages of plant growth (though precipitation impacts these results).  To my eye, the pyramid was still difficult to discern in all of the images. Thankfully, owing to the known location of La Danta a pyramid training sample can be generated and the results can identify areas of similar spectral characteristics. These locations, once refined and examined further, can narrow down the search area for archaeologists.

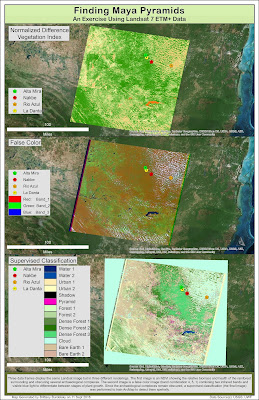
Map deliverable for this module. showing three renderings of a Landsat image. 
     The supervised classification was generated with the help of the Image Classification toolbar in ArcMap. The classes I used were dense forest, forest, water, urban, bare earth, cloud, shadow, and the La Danta area for 'pyramid.' Despite many attempts I was unable to go without multiple classes of the same type. That is, when I combined my training samples (for instance, the two bare earth classes) it introduced greater error in the resulting image. My final classification shows some areas where pyramids could potentially be found. I think, in addition to other contextual visual information, the results could help in determining potential areas to survey.


Thursday, September 8, 2016

Special Topics: Module 1 - Finding Maya Pyramids (Part 1)

     This assignment takes me back to the Remote Sensing course but now I get to apply those principles to finding Maya pyramids. Space archaeology, hooray! This first assignment sets the stage for the next two weeks by preparing the data for a supervised classification (next module). We use past (2001) Landsat 7 ETM+ data to examine the location of a known Maya pyramid complex (La Danta, discovered in 2009). Using different band combinations (see below) we looked for any distinguishing characteristics around the pyramid that might help in identifying the locations of other pyramids in the jungle (in the next module).

     My map shows a full extent panchromatic image (band 8, 15m resolution) of the broader area surrounding the pyramid, La Danta (a Maya pyramid). A true color and false color image of the area in the immediate vicinity of the pyramid are shown. The true color (band combination: 3 - visible light [red], 2 - visible light [green], 1 - visible light [blue]) and false color (band combination: 4 - near infrared, 3 - visible light [red], 2 - visible light [green]) images were generated using the Composite Bands tool (Data Management toolbox). Both the contrast and the brightness were altered to enhance the image and the images were pansharpened using the panchromatic band (band 8). The pyramid is difficult to visualize at these band combinations as it was, at the time, obscured by vegetation.

A map showing a full extent panchromatic image of an area of jungle in
 Guatemala containing several Maya pyramid complexes. Two composite
images (one true color, one false color) highlight an area where a pyramid,
La Danta, is obscured by dense vegetation.