Gathering the data was quick since the maps and information were scanned and provided to us. To prepare the imagery for use in ArcMap I copied and pasted the images of "my" maps into paint and edited them to remove extraneous white space. Georeferencing all of the data was time consuming. Additionally, digitizing also took longer than expected.
At first, the georeferencing part of the lab went smoothly. I georeferenced a grid map of Oaxaca Valley after a good bit of analysis of the modern topography of the valley. The image gets quite pixelated when zooming in so I had to find a balance between scales to guide alignment and referencing. I then georeferenced the images of my unit only to realize that my original topography, in the area of my assigned units, was skewed to the east. I realized that this resulted from my methodology for georeferencing. I went for overall map accuracy while I should have been seeking accuracy in the relatively small area of my units. Thus, I went back to the drawing board and georeferenced the grid map with emphasis on accuracy in my given area. With better accuracy in my region, I felt confident georeferencing all of my unit squares.
With the data in my maps georeferenced I went ahead and began digitizing my data. Through the course of digitizing I got very comfortable with the Editor toolbar and the Snapping toolbar. Some of the images became skewed after georeferencing making them difficult to interpret (along with their pixelation). Some numbers were illegible so I had to keep the original data handy for reference. [A quick side note, this assignment made me wish for multiple monitors. I think it would have relieved some of the burden of minimizing windows and managing many windows at once.] Once I finished digitizing all of the data and began to compile maps I noticed that I had some errors. For instance, when I placed the occupation data on top of the land cover data there were alignment issues. Hopefully, for learning purposes these errors are not egregious. In a more rigorous situation (work or publications) I would have spent much more time on this lab. As it stands, this assignment took two weeks to finish. I helped a coworker georeference a map from the 1930s and it took about 45 minutes. It was, however, less challenging data and required no digitizing.
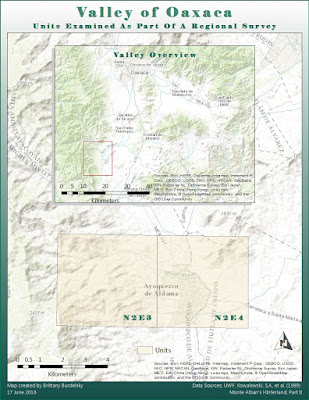
I provided all the maps I compiled to complete the assignment. One of my units had several maps (unit N2E3A-C) because many time periods were encompassed by the area. I tried to visualize all of the data efficiently hopefully you think so too.
 |
| Map 1 - An Overview of Oaxaca Valley showing the location of my assigned units. |
 |
| Map 2 - A map showing the same unit split into multiple occupational periods overlaid upon landcover data. |
 |
| Map 3 - A map showing the same unit split into multiple occupational periods overlaid upon landcover data. |
 |
| Map 4 - A map showing an additional unit (adjacent to the one in the previous maps) overlaid upon landcover data. |
No comments:
Post a Comment