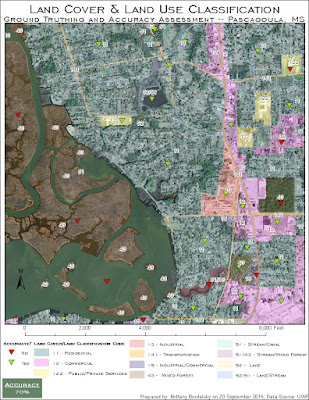
There are several ways to design a ground truthing/accuracy assessment survey. The method chosen is a function of available resources (time, man power, budget). I chose a stratified random sampling method wherein which I chose a random point location in the various classification groups. I tried to create a representative sample with at least a single random observation in each category. The random points were checked against Google Maps street views or for areas where there is no street view zooming in as close as possible.
Typically an error matrix is generating to examine overall accuracy, user accuracy (commission error), and producer's accuracy (omission error). For this assignment we were only asked to calculate the overall accuracy (percentage of correct classifications). Below is the map deliverable showing the overall accuracy percentage and the points used for accuracy assessment. I had the highest success in identifying residential areas and the lowest success at classifying vegetation (time for more hikes!). I also experienced some confusion between commercial and industrial. This exercise was incredibly helpful and addicting. It was hard for me to not spend too much time on every part of the map. The best feeling for me was starting to familiarize myself with Pascagoula. I was getting to the point where I could orient myself by "landmark" shapes of roofs, water towers, and schools.
 |
| Map 1: Land Use/Land Classification Ground Truthing and Accuracy Exercise |
No comments:
Post a Comment