Thursday, July 30, 2015

GISProgramming: Module 10 - Creating Custom Tools

Creating Custom Tools   
     Custom tools. As if automating geoprocessing tasks with Python couldn't get any better, you can integrate your scripts with ArcGIS toolboxes to make custom tools. The general process is as follows (if you already have a script in mind):
1) Create a toolbox in ArcMap in a logical location
     For this exercise, the toolbox went into a Scripts folder containing the script that'll be used to              make my custom tool.
2) Add the script to your toolbox, creating a new tool.
     It is prudent to make a copy of your script and give it a different name as you'll be modifying the        script to suit designated tool parameters in a later step. This allows you to retain the original                should anything go awry. Right click on this new toolbox, select Add > Script. Navigate through        all the options in the Add Script wizard. (Test the tool to make sure you get the desired result.)
3) Set parameters for your new tool
     This can be done in either of two ways. You can set the parameters through the Add Script wizard (initial dialog window) or through the Properties box of the tool (accessed through right clicking your tool). Once parameters are set within the tool
4)  Modify your script
     Set parameters in your script by replacing file paths and file names with the corresponding parameter index within the tool (using the .GetParameter() function). Replace any print statements with message statements (like the .AddMessage() function) to ensure the progress of the tool is being reported in the Results window and progress dialog box.


Example: A MultiClip Tool
     The general process explained above was used to create a custom MultiClip tool. I took a pre-existing script and modified it to meet parameters specified when creating the tool in ArcMap. This tool runs the Clip function on multiple layers simultaneously. I took several screenshots highlighting the tool interface, the results window, and the spatial result of running the tool.
The tool interface for a custom tool made in ArcGIS using a Python script.
Note the four tool parameters which have corresponding lines of code within the script.
The tool results window displaying messages displaying the progress of the tool. 
The spatial result of running this tool.
Several layers are clipped to a given spatial extent.  


GISProgramming: Participation Assignment 2 -- GIS, Computer Science, and Archaeology

     In the vein of the previous participation assignment I found an article regarding GIS in archaeology. This article discusses the use of a WebGIS to share all manner of archaeological data (maps, aerial imagery, geophysical survey data, and excavation reports). This provides a useful, interoperable platform that georeferences various types of archaeological data for a given site. The article provides a great overview of Open Geospatial Consortium standards ensuring interoperability, metadata standards, and open source GIS programs. It also reviews the web architecture (a framework that uses a Python environment — Django). Data is uploaded as an ESRI shape file (vector) or GeoTIFF (raster) and then the user is prompted to provide metadata and set access privileges.  
     The matter of secure access is discussed since there are various academic institutions involved. Certain functionalities are given to registered users versus unregistered users creating a user hierarchy. The authors also addresses cooperation between various institutions. The authors are developing this system for Aquileia, Italy. This site is a region of international research interest, meaning there is a wealth of archaeological data to potentially share with remote colleagues. Not only would a site-specific WebGIS be fostering a cooperative environment it also provides an open-source platform that can quicken the pace of discovery and analysis. A WebGIS is also cost-effective (a major concern for any researcher/academic institution). I can see this framework having great utility at an archaeological site. There are issues to work out like which institution bears the ultimate weight of developing and maintaining the host site as well as who would ultimately be in charge of overseeing content. This would require that an archaeologist have an understanding of IT or be able to outsource to an interested computer science colleague (a great way for inter-departmental cooperation). At any rate, what an excellent way to gain an in-depth knowledge of a site while communication with fellow researchers. GIS is quickly becoming an integral, necessary aspect of archaeological research.

Citation
Gallo, P., & Roberto, V.  (2012).  ANTEO: Sharing Archaeological Data on a WebGIS Platform.  In  L. Fozzati and V. Roberto (Eds.), Proceedings of the 2nd Workshop on The New Technologies for Aquileia. Retrieved from http://ceur-ws.org/Vol-948/paper3.pdf

Friday, July 24, 2015

GISProgramming: Module 9 - Working With Rasters

     Last week we examined vector data and geometries. This week's assignment looks at the alternate data type used in GIS, raster data. This module covers examining and manipulating raster data programmatically. To do so, the Spatial Analysis extension must be licensed and enabled. Writing in code that checks for the extension/module is helpful for ensuring that any person who makes use of the program on their computer doesn't get an error but instead receives a message the the extension is not available to them. The program I wrote this week does just that. If the extension is licensed then the program runs to completion. If the extension is not available then an alternate message prints that the user does not have access to the extension.
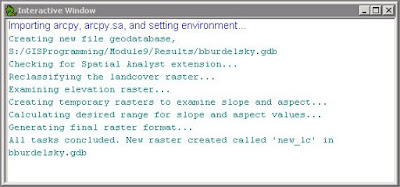
      For this programming exercise, we do have access the the Spatial Analysis module. The module is imported with all of its tools. Two particular rasters are used, a landcover and elevation raster. The Remap class and Reclassify tool are used to reclassify landcover values. Then, a particular range of slope values and aspect values are used to select specific parameters of the elevation raster. All of these raster outputs and selections are temporary. They are combined using map algebra and the final raster output is saved as a permanent file. Below is an image of the final raster result. There is also a screenshot of the interactive window showing the progression of the program by way of print statements.
    
The final raster result showing reclassified landcover data
that has a specific range in slope and aspect.

Screenshot of the interactive window showing print statements that track the progress of the program. 
     I found this program much easier to write than last week's foray into geometries. The geometries program required nested for loops and this program only required a single if/else statement (which I find conceptually simpler perhaps due to previous exposure in a different programming language).  

Friday, July 17, 2015

GISProgramming: Module 8 - Working with Geometries

     This module focuses on working with geometry objects. All features are comprised of a set of points. These points are the vertices of a feature and they are accessed through geometry objects. Whether reading or writing geometries, geometry tokens (SHAPE@XY, SHAPE@, etc) act as shortcuts for accessing specific properties of a feature. Cursors are integral in accessing geometries or creating new geometries. The previous module introduced cursors which helped writing this week's script as I needed to use them again. The program this week practiced reading geometries and writing point data to a text file. 
     The program accesses the Object IDs, point data for all vertices, and attribute data (such as the name of the feature) for features in a polyline shapefile (by way of the Search Cursor). Using a series of nested for loops, the point data for the vertices is gathered and written to a text file (.getPart(), .write, and string module). Below is a screenshot that prints the data (that was simultaneously written to a text file). The program also contains print statements to keep track of what steps of the program have been accomplished.
A screenshot showing the results of a program that
writes geometric and attribute information to a text file. 

     While I found this module conceptually straight forward, I had some issues writing the script for this program. Specifically, I had issues writing information to a text file. This was mostly due to improper syntax and an incorrectly tabulated iterative line of code. Once I let it sink in that the Search Cursor returns tuples, I found the syntax much easier (like properly referencing and printing the data within the tuples). The solutions to my issues were so simple but I got really hung up on them. I hope my DUH moments are easier to catch in the future. 

Thursday, July 9, 2015

GISProgramming: Module 7 - Exploring and Manipulating Spatial Data

     This module introduced exploring and manipulating spatial data with cursors. This week I worked specifically with the Search Cursor to find certain features in a feature class and fill a dictionary with those selections. Cursors are part of the Data Access Module within ArcPy. Also introduce this week was the Describe function.  The combined use of these tools and functions helped accomplish the aim of this week's assignment. 
     My goal was to produce a program that carried out several tasks -- creating a new geodatabase, moving files into that geodatabase, using a Search Cursor to select specific features in a feature class, and then populate a dictionary with those selections. It did not take long to write this program but I was held up by the Search Cursor. Optionally, the Search Cursor can include a where clause for an SQL query. The particular query I wrote used a combination of single and double quotations. That is an issue for Python, as it will try to interpret these quotation marks as strings and confuse where the string begins and ends. Escape clauses are the solution but I had difficulty employing them successfully. I kept receiving syntax errors for this line of code. My solution was to write a variable for the where clause/query an avoid the escape clauses altogether. This worked well and the program could finally run to completion.  
     I have included a screenshot of the interactive window for this program. I wrote in print statements before and after each task I needed to perform to help keep track of the progress of the program. I found this one of the more difficult programs to write. I usually arrived at a solution quicker for other programs but once I spent some time looking through forums and various ArcGIS Help pages I was able to get work arounds for errors I was encountering. Again, the satisfaction in solving my issues and getting my program to run was great. I hope that I am able to keep this up as the programs and concepts become more difficult. 


An interactive window screenshot of a program that uses print features to track several tasks including creating a new geodatabse, using a Search Cursor to gather specific data, and population a dictionary with that data.